Information Design Data Visualization Visual Design Design Systems UX Research

Open Budgets India — a portal & story generator for public budget data

As the sole designer-researcher on a civic-tech open-data initiative, I studied how analysts and citizens read budgets, then designed a public data portal, a story-generator tool, and a repeatable visual-thinking system that launched and drew national press.

My role
Designer, Researcher & Strategist (solo)
Timeline
8 months
Organisation
Centre for Budget & Governance Accountability (CBGA), New Delhi
Tools
Excel, R, Tableau, Illustrator, Sketch
What kind of design this was

Information & data-visualization design, with a reusable visual system

This was primarily information design and data visualization — making complex, five-dimensional budget data legible — delivered as digital product / UX design (a public portal and a story-generator tool) and underpinned by a repeatable visual-thinking design system so the work could scale beyond me. It was rooted in UX research with the analysts and researchers who actually read budgets.

About the project

Turning public budgets into stories anyone can read

The aim was to develop a comprehensive, user-friendly open-data portal with a story-generator tool for budgets in India. The tool intends to educate users into developing insights from available budget datasets and help them answer one powerful question: "How does the government utilise our money?"

About CBGA. The Centre for Budget and Governance Accountability is an independent non-profit that enhances transparency and accountability in governance through rigorous analysis of policies and budgets, fostering people's participation in public-policy processes by demystifying them.

Reason: my graduation project — I wanted hands-on experience working with live data.

The problem I set out to resolve

Budget data that shut citizens out

Public access to government budget data in India is constrained in several ways. Citizens' access diminishes drastically as you move from the Union Government down to the subnational level — a gap that severely constrains public engagement in budget processes at the grassroots. The documents also arrive in varied formats that are not machine-readable.

Who it targets: everyone affected by the budget — budget researchers, policy makers, policy analysts, journalists, government officials, and the everyday budget enthusiast. How it helps: an open budget-data portal can significantly boost citizens' engagement in budget processes and improve researchers', analysts' and journalists' use of appropriate budget data — generating useful inputs for policy and budget formulation at every level, strengthening the country's public information.

Research areas studied before entering the problem: understanding budget basics and the whole ecosystem; exploring multiple styles of analysis to make data easier to consume; understanding budget documents and terminology; and learning how machine-readable data can be used here.

Process

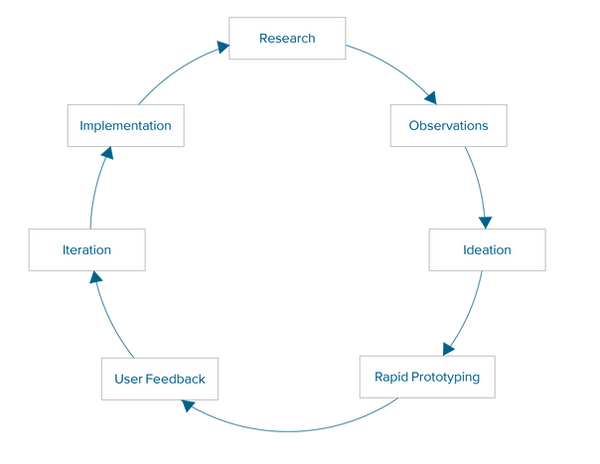
An iterative, research-led design process

This was the first project of its kind to handle non-public budget data, so the process started by respecting mandatory government laws and restrictions from the outset. To build an intuitive portal experience I followed an iterative loop: literature review and user interviews → identifying patterns in datasets, user behaviour and pain points → brainstorming ideas around people's needs → quickly prototyping with developers and testing with users → releasing to the world → using feedback to fuel the next iteration. To know if a solution was on target, I tested it with the end users of the tool.

Iterative process
The iterative research-and-design process
"In a world governed by data… visualisation has emerged as a shared language. Charts, maps, graphs, diagrams… all transcend text, spoken language and cultures to help people understand one another and connect." — Scott Berinato

Inspired by that idea, I proposed a revised, repeatable framework for visual thinking, whose goal is to augment the user's trust with the visual aid and thereby move analysis forward intelligently.

Visual thinking framework
The repeatable "visual thinking" framework I proposed

Understanding the problem

I interviewed users who were mostly researchers or analysts from CBGA, and studied existing budget visualisations and tools.

Creating ideas

While brainstorming, I worked through the nature and purpose of the process: Who will see this? What do they want? What idea do I want to convey? What could be shown, and how? Is it conceptual or data-driven? Am I declaring something or exploring something?

Refining ideas

I measured user feedback on the rough prototype on effectiveness and ease of understanding. Three keywords stood out from the surveys: structure and hierarchy, design clarity, and simplicity. I returned to observation and ideation, dividing the story-generator project into four phases and refining it to impress and persuade users.

Presenting & practicing

I added delightful interactions and animation to the portal and tool to create captivating visual storytelling, so users could form a new understanding of the data, change minds, and affect policy change — in a process of continuous iteration. The Open Budgets data portal launched, and an alpha Story Generator tool followed.

Visual exploration & the design system

From explorations to a final visual system

I explored colours, layout and illustration styles while working within governmental constraints — moving across multiple-colour, monochromatic, and dual-colour systems with elements specific to each sector — before arriving at the final selection. The complete repository of these design explorations lives on GitHub so external designers could contribute.

Multiple colours
Multiple colours · sector-specific elements
Monochromatic
Monochromatic · sector-specific elements
Final visual system
The final visual system for the budget portal
My responsibilities & artifacts

The only designer in the organization — wearing every hat

As part of an open-data initiative and the sole designer in the organization, I played designer, researcher, and strategist, and used the project's openness to collaborate with external design communities.

Design responsibilities
  • Understood the whole budget ecosystem
  • Set design goals for each phase of the project
  • Empathized with user needs and goals
  • Conducted user interviews and gathered feedback
  • Ideated and re-iterated on designs
  • Maintained a repository for external designers to contribute
  • Worked closely with teams across multiple locations
Artifacts delivered
  • Public Open Budgets data portal (beta, launched)
  • Story Generator tool (alpha)
  • A repeatable visual-thinking framework
  • Visual system: colour, layout & illustration explorations
  • Open GitHub design repository
  • User-research insights & iteration documentation
Impact as a designer

A public launch — and national press

The project was covered widely in national media:

Note: this is an overview of the process and sample explorations — happy to discuss the research insights, interviews, analysis, feedback, observations and iteration process in person.

← Previous: 1mg e-Healthcare Next: Indian Stock Market (Sensex) →